


Super Bowl Latency Study Comparison
A variety of organizations and individuals perform an analysis comparing latency across various platforms for watching major events like the Super Bowl. The findings frequently differ, especially when examining patterns over several years, causing confusion about the results within the industry.
Why do measurements differ?
Methodology
Phenix has been conducting its Super Bowl latency study since 2020 and sets itself apart in a couple of key ways.
First, we define what end-to-end means by having Phenix personnel present in the stadium at the game each year. Defining the endpoints when talking about end-to-end is essential when attempting to talk about and compare measurements from various reports. Phenix is comparing the performance of the many different streaming platforms and devices to the live action on the field, offering a more accurate view into latency and drift.
There are several other latency reports and posts for the Super Bowl, most measuring against an over-the-air ("OTA") or Cable service without indicating how much latency there is in the OTA or Cable feed they are comparing to. None of them have people in the stadium, which makes our study unique and gives a complete view of latency through the video workflow. Given so much variability between users of OTA or cable providers, such limitations yield inconsistent results and underreport end-to-end latency.
Second, our latency measurements are from many individuals across the United States and use a variety of streaming devices (i.e.; mobile, laptop and connected TV), providing a larger data set and broader perspective on the general audience's viewing experience, leading to a more robust understanding of the overall viewing experience.
This approach of having an individual in the stadium, a wide variety of devices and a distribution of study participants across the United States allows us to present a more realistic depiction of both average latencies and audience drift (the time between the fastest and slowest stream).

Technically one key aspect of measuring latency end-to-end is that each individual user benchmarks their traditional feed so that when they subsequently measure the difference between their OTT service and their traditional service, the latency measurement is accurate.
This graphic shows how, in this situation, a user is using Cable as their traditional feed, first they measure the latency between the action in the stadium and their Cable feed establishing their personal benchmark, then they measure the latency between each service starting with Paramount+ and their Cable feed. Combining these results in an accurate measurement of latency from the action in the stadium to the OTT video feed.
Drift
Audience drift is another element to consider. It serves as a gauge for the variance among audience members on the same platform, akin to different vehicles traveling at varying speeds on a shared route. While the specifics may differ, the essence remains the same; ultimately, some individuals reach their destination ahead of others.
Just as with our analogy, drift tends to increase with higher latency delivery technologies. The longer the journey, the more variability in speed and travel times you can expect, even if everyone is traveling the same route with similar cars and driving in a relatively consistent manner.
This phenomenon is also evident in our latency studies. In the world of streaming technology, this leads to discrepancies between viewers watching the same game using the same OTT platform, resulting in variations in which service appears to be the fastest. In a more real-world scenario, this can cause problems for people in different locations just trying to share in the excitement of watching the big game even when they’re using the same OTT service.
For example, based on our audience drift numbers for 2024, a single measurement on any service could show 60 seconds of stadium-to-glass latency (see the orange bar in the diagram below), while at the same time other viewers experience much different results within the same service for example with Fubo from as low as 30 seconds up to 160 seconds.
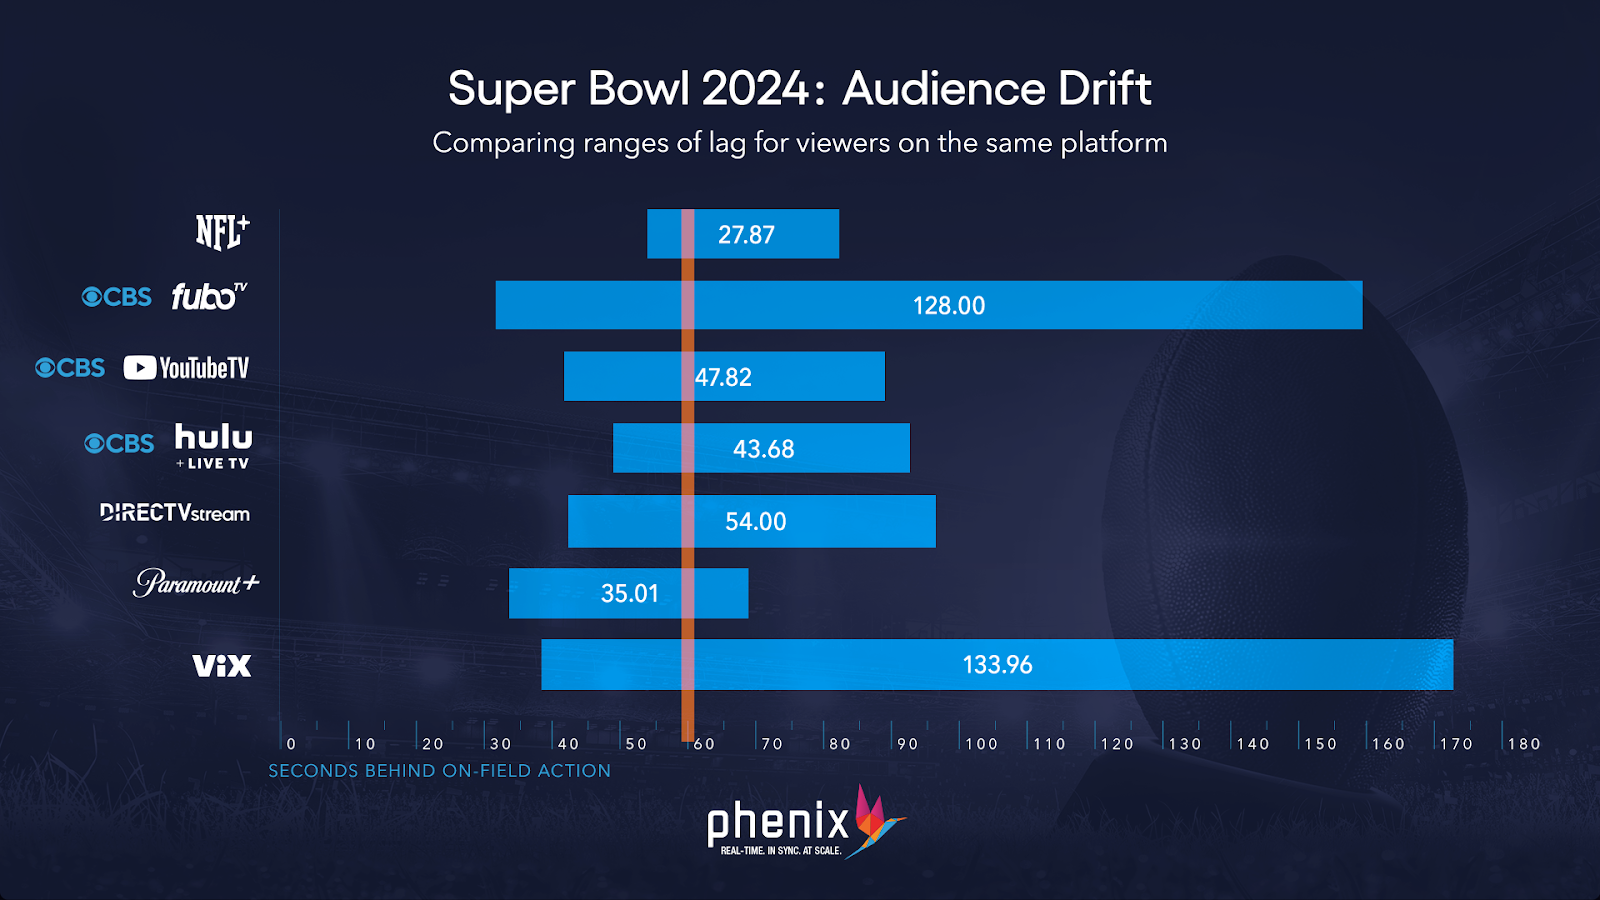
(Source: 2024 Super Bowl Latency Study)
Conclusion
In conclusion, Phenix is dedicated to measuring latency and drift for popular live sporting events being streamed online and providing these state of the industry reports. Our unique approach includes having someone present at the event, taking measures with multiple devices under a variety of real-world network conditions with a significant test audience that’s geographically distributed. With our holistic approach, we believe the industry can more easily see where streaming technology stands and where the growth can come from.